Number of metros with declining home prices increases 67 percent
The number of U.S. metros posting home price declines increased 67 percent in Q1 2019 compared to the previous quarter as the downshift in home price appreciation spread to more markets.
Twenty-five of 178 metro areas (14 percent) posted year-over-year declines in median home prices in the first quarter, according to the National Association of Realtors. That 67 percent more than the 15 metro areas posting price declines in Q4 2018.
Three months ago we noted the declines in those 15 metro areas, led by San Jose, California, signaled an important downshift in the real estate recovery of the last seven years. Now with nearly twice the number of local markets shifting into reverse, the downshift is even more apparent.
Declines in High-Priced Markets
Once again San Jose posted an annual decline, with median home prices dropping 11.1 percent from a year ago in Q1 2019, according to the NAR data. Other markets among the 25 posting annual price declines included Naples, Florida (down 7.7 percent); Bridgeport, Connecticut (down 7.10 percent); Anaheim-Santa Ana-Irvine, California (down 1.20 percent); and Colorado Springs, Colorado (down 0.10 percent).
“You are seeing a slowing rate of appreciation. But in the markets we operate in, the beach cities of Southern California, you are still seeing appreciation,” said Michael Mahon, president with First Team Real Estate, based in Irvine, California.
Mahon noted that inventory is up by 20 percent or more in many of the local markets that First Team operates in, which is helping to create “price stabilization” in those markets.
“The beautiful part about that is you have equilibrium, where it is neither a seller’s nor a buyer’s market,” he said. “Buyers aren’t overpaying because they have more choices. Sellers still are enjoying appreciation.”
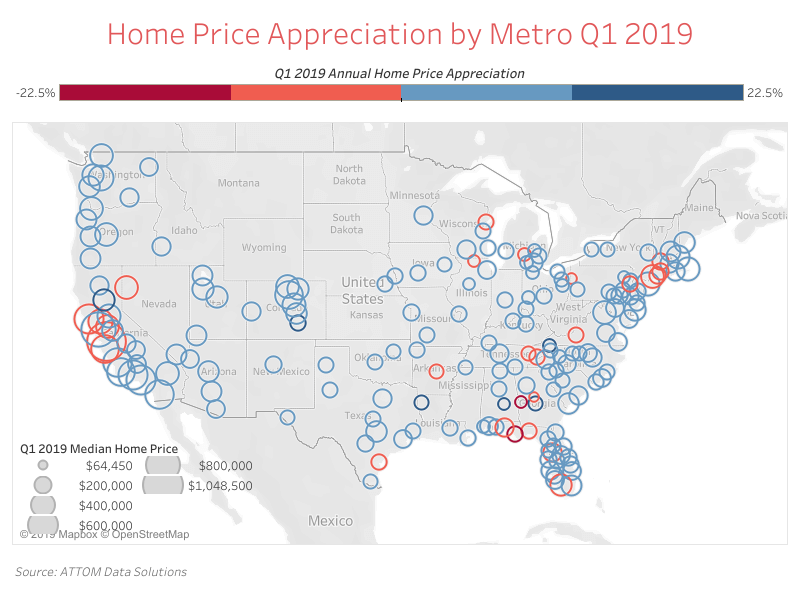
Several of the same markets with declining home prices in the NAR survey also showed posted declines in data from ATTOM Data Solutions, which uses public record data to track both sales listed on the multiple listing service (MLS) as well as unlisted properties not captured by the NAR survey.
According to the ATTOM data, San Jose median home prices in Q1 2019 were down 8.8 percent from a year ago while Naples posted a 5.4 percent annual decrease and Bridgeport posted a 4.1 percent annual decrease. The common denominator among these three markets is that all three have median home prices well above the national median. Similar to the NAR data, the ATTOM data shows 29 of 188 metro areas analyzed (15 percent) with a year-over-year drop in median home prices
Strong Growth in Moderately Priced Markets
Meanwhile, there was also a common set of markets posting strong year-over-year increases in home prices in both the NAR and ATTOM data. These included Spokane, Washington (up 10.0 percent according to the ATTOM data); Atlantic City, New Jersey (up 10.0 percent); Akron, Ohio (up 9.8 percent); Omaha, Nebraska (up 9.7 percent); and Kennewick, Washington (up 9.7 percent).
The common denominator among these fastest-appreciating markets? All have median home prices close to or below the national median of $233,000, according to the ATTOM data.
Affordability, or lack thereof, is driving price trends both on the downside and upside, according to Lawrence Yun, chief economist at NAR.
“The condition of extremely high home prices may not be sustainable in light of many alternative metro markets that are much more affordable,” said Yun in a statement released with the NAR report. “Therefore, a shift in job search and residential relocations into more affordable regions of the country is likely in the future.”

