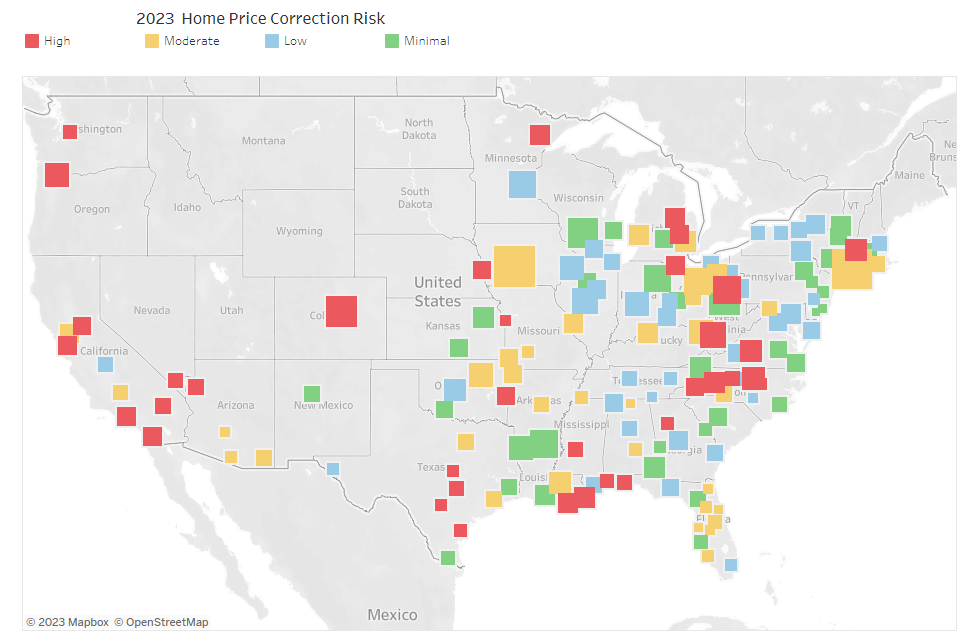
Bidding behavior by local real estate investors on Auction.com provides a good barometer of home price correction risk in the next three to six months. That’s because these local investors are highly in tune with local market conditions and their success depends on them accurately predicting the future market conditions in which they will sell or rent the renovated properties originally purchased as a distressed property at foreclosure or bank-owned auction.
Specifically, the discount cushion investors build into their maximum bid at auction reflects their view of future home price appreciation in the local market. In 2019, investors buying at foreclosure auction nationwide were willing to pay 60 percent of a property’s estimated after-repair value on average, according to Auction.com data. In other words, investors were building in a 40 percent discount cushion that would absorb the holding and renovation costs associated with distressed properties while still allowing them to generate a positive return when reselling or renting the property three to six months down the road.
Given that home price appreciation in 2019 averaged just under 5 percent nationwide, according to the National Association of Realtors (NAR), that 40 percent discount cushion can be used as a nationwide benchmark to help determine what investors across the country are expecting in terms of future home price appreciation in the second half of 2023 based on their bidding behavior in the first half of 2023.
In the first quarter of 2023, investors were baking in a 46 percent discount on average at foreclosure auctions nationwide. That 6 percent extra discount cushion indicates investors were anticipating home price appreciation to be 6 points lower than the 5 percent appreciation of 2019. That would of course put home price appreciation into negative territory, albeit slightly at 1 percent negative and on a nationwide basis – not necessarily in every local market.
The nationwide home price correction that Auction.com bidding behavior anticipated in the first quarter has been realized. Nationwide home price appreciation has now decreased on a year-over-year basis for four consecutive months, from March to June, according to the NAR.
But Auction.com bidding behavior in the second quarter indicates home price appreciation may flatten out or even turn positive in the second half of 2023. Investors purchasing at foreclosure auction in the second quarter baked in an average discount of 41 percent nationwide, just 1 percent above the 2019 average.
As visualized in the heat map here, Auction.com bidding behavior data at the local market level provides a much more nuanced view of home price correction risk in the second half of 2023. Using the same methodology as described above for nationwide home price appreciation, each market’s average foreclosure auction purchase discount in the second quarter of 2023 can be compared to its 2019 benchmark and then compared to all other markets across the country to determine relative home price correction risk.
In the top quartile of risk among 152 metro areas nationwide are those where the foreclosure auction discount was at least 3 percentage points higher in Q2 2023 compared to the 2019 average. Those high-risk markets include St. Louis, Columbus, Ohio, Dallas-Fort Worth, Kansas City, and Tulsa.
In the second quartile of risk are those metro areas where the foreclosure auction discount in Q2 2023 was between 1 percent below and up to 3 percent above the average discount in 2019. Those moderate-risk markets include Washington, D.C., Detroit, Atlanta, Minneapolis-St. Paul, and Las Vegas.
In the third quartile of risk are those metro areas where the foreclosure auction discount in Q3 2023 was between 1 percent below and 7 percent below the average discount in 2019. Those low-risk markets include Chicago, New York, Baltimore, Houston, and Cleveland.
In the fourth quartile of risk are those metro areas where the foreclosure auction discount in Q3 2023 was between 7 percent below and 21 percent below the average discount in 2019. Those minimal-risk markets include Philadelphia, Pittsburgh, Richmond, Virginia, Milwaukee, and Peoria, Illinois.
For more information on real estate market analysis, follow us on LinkedIn.
See the below graphs in a new window:
Second-half 2023 risk heat map: https://lnkd.in/gbBdBiGU
First-half 2023 risk heat map: https://lnkd.in/gT8jiib3
Links To Helpful tools:
- Remote Bid: The future of Foreclosure auctions. Browse, bid and win select Foreclosure properties from anywhere with ease. Qualify for remote bid or meet with a specialist today.
- Frequently Asked Questions: Find answers to frequently asked questions from Auction.com users.
- Foreclosure Home Properties Help Center: Navigate through a Foreclosure auction with confidence using our quick access guide. Learn terminology and catch up on State requirements. We have tailored sections for Foreclosure and REO properties.
- Real Estate Auction Calendar: Find real estate auction events in your area. Filter by State, asset type, and date to get a list of properties near you. Or just search com to start with a list of properties with our useful filters
- Foreclosure vs. Bank Owned: Watch our educational video on Foreclosure vs. bank owned properties and find out which one is right for you.

